
Financial Performance, Clearly Explained
Financial intelligence for renewable energy.
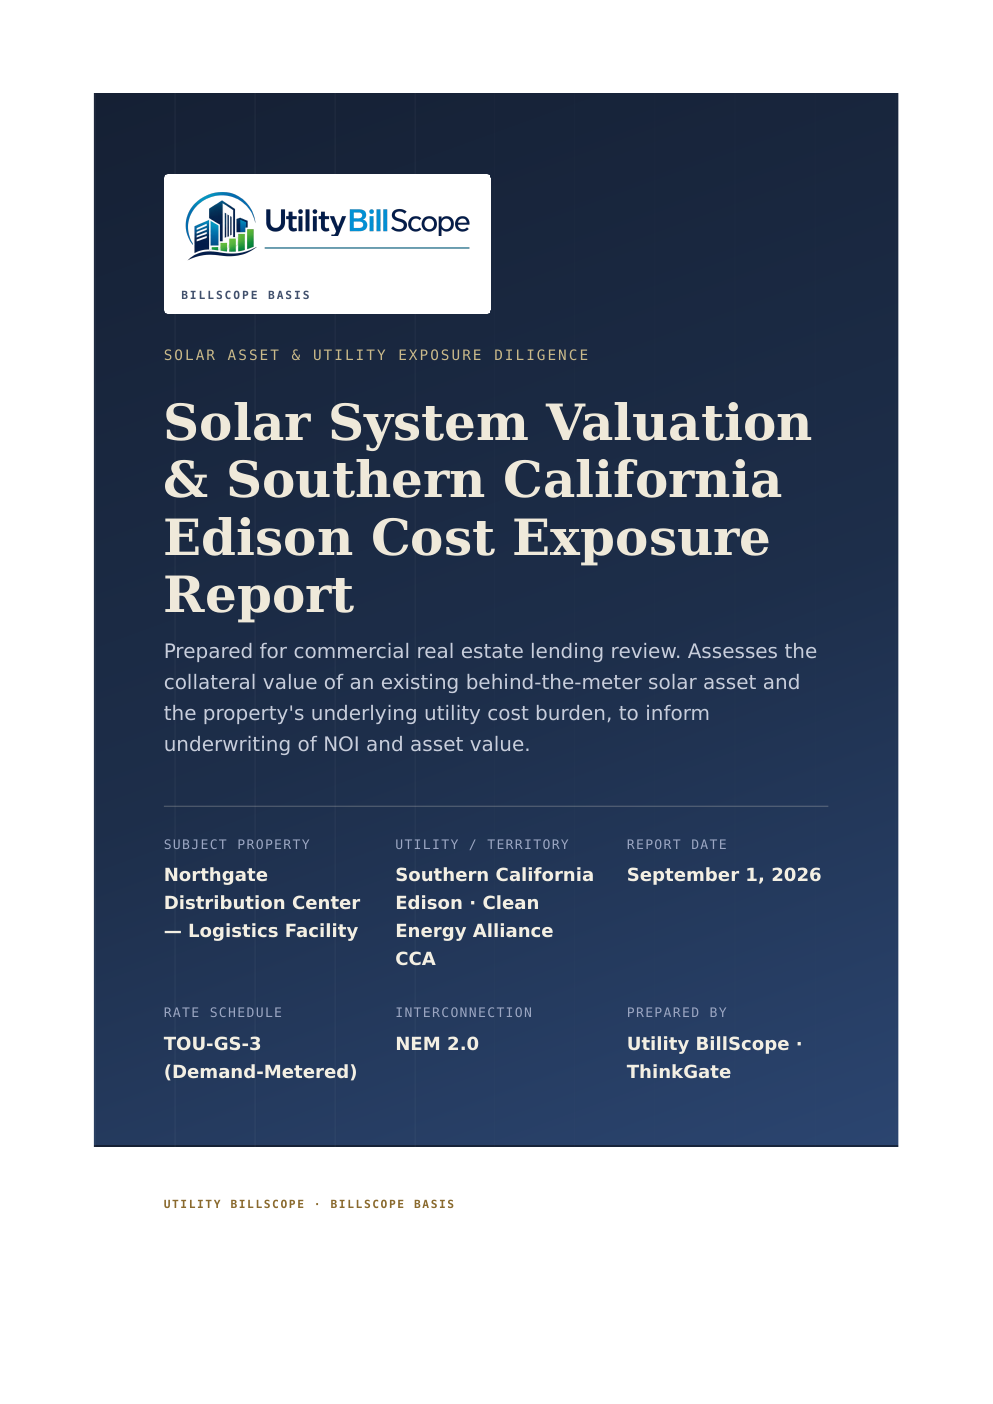
Utility BillScope connects commercial energy investments to ongoing cost and performance—from the original decision through the life of the asset.
Energy investments deserve ongoing financial oversight.
Commercial renewable energy investments begin with forecasts, assumptions and expected returns. Once projects are built, the expectations that supported them should remain visible as costs and performance change.
Investment Recovery Timeline
Fragmented energy data, transformed into financial intelligence.
Utility BillScope reconciles and validates utility bills, solar production and investment assumptions to create a trusted, current view of performance, risk and opportunity.
Analyze
Utility bills, solar production and original investment assumptions are reconciled into a current assessment of savings, return and cost exposure.
Monitor
Daily, weekly, monthly and annual reporting keeps changes in production, demand, rates and utility cost visible.
Manage
Approved actions—from rate transitions to scheduled maintenance—are carried through completion and verified against the financial result.
Built for decisions that extend beyond solar monitoring dashboards.
Commercial renewable energy performance affects operating costs, asset value and investment outcomes. Utility BillScope reconciles utility cost and solar production into a forward-looking financial view of the asset.
Financial conclusions
grounded in evidence.
Every conclusion remains connected to the records, assumptions and operating conditions behind it.
ThinkGate
Data becomes decision-grade when its source, timing and treatment can withstand review.
• Verify actual ROI and payback
• Measure savings since installation
• Compare expected versus actual value
• Identify recoverable financial value
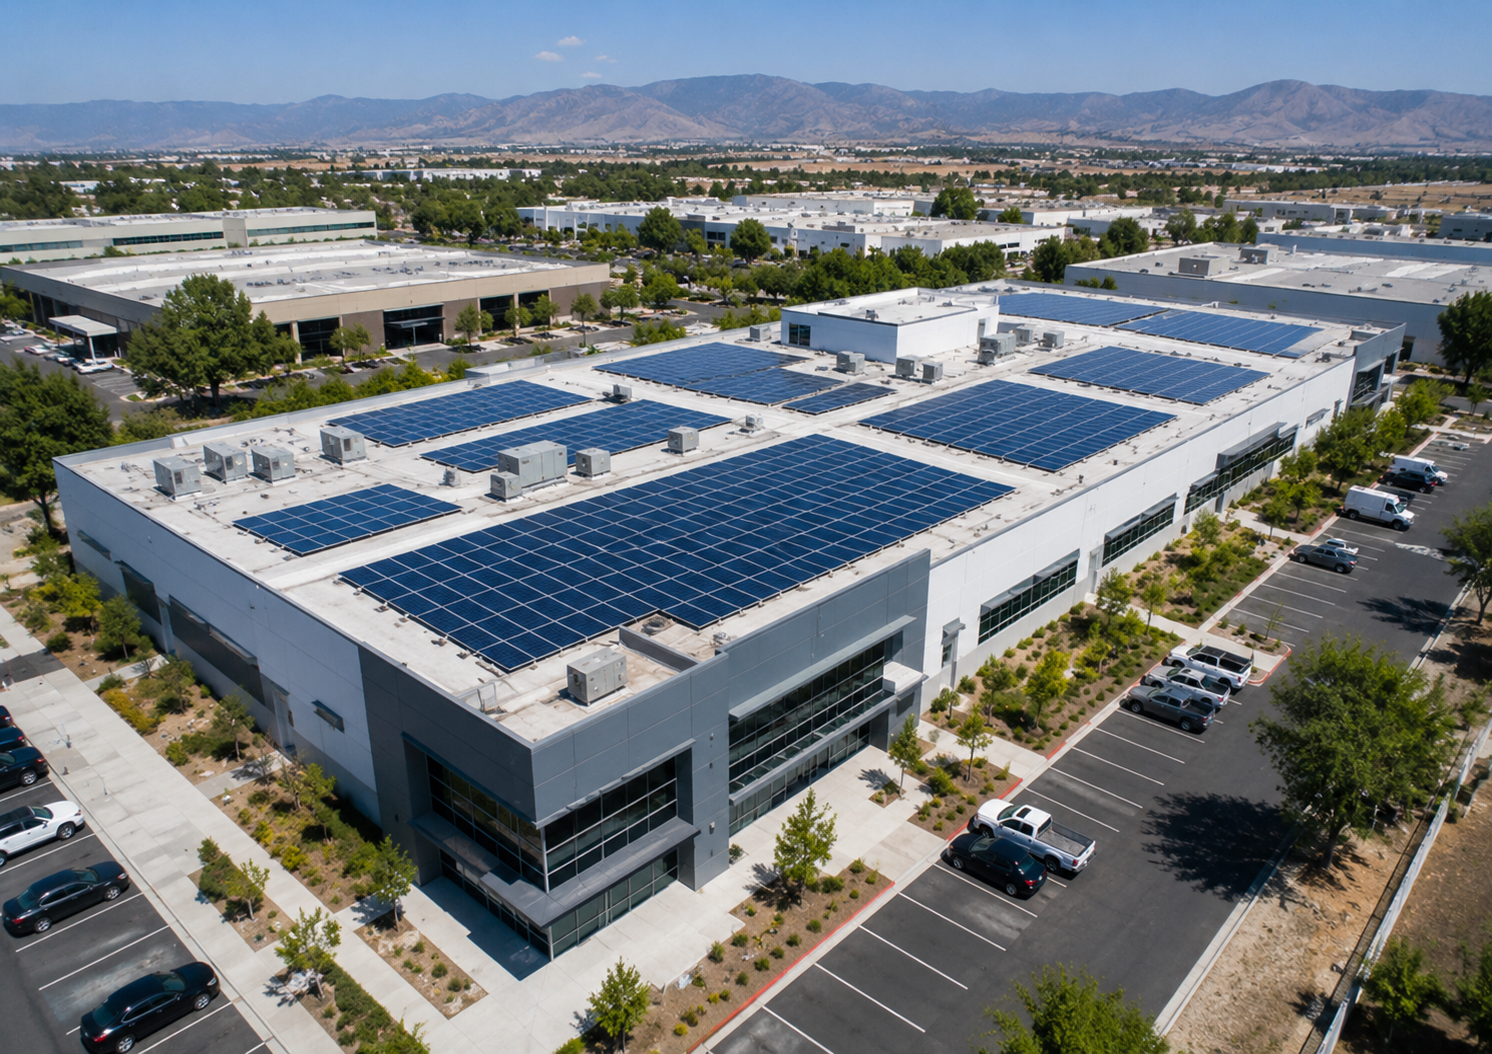
Is Your Commercial Solar Investment Delivering the Return You Expected?
Track Solar ROI. Recover Lost Value.
Utility BillScope tracks whether your commercial solar investment is delivering the financial return you expected—and identifies what is reducing it.
Utility Data. Actionable Insight.
Built Around Better Questions
What Happened?
See how utility costs, demand, grid purchases and solar production changed over time.
What Matters?
Identify the performance issues, rate structures and operating patterns having the greatest financial impact.
What Happens Next?
Prioritize practical actions, verify the results and continue monitoring where authorized.
Why Utility and Solar Data Must Be Reviewed Together
Solar production alone does not show whether a commercial solar investment is delivering the expected savings.
Utility data shows what the building purchased, when demand occurred and what the utility charged. Solar data shows what the system produced.
Utility BillScope brings both sides together to measure what happened and identify what should happen next.
How It Works
1. Connect Your Property
Authorize utility and solar data access where available and provide any bills, exports or documents needed to complete setup.
2. The Platform Verifies Your Data
Utility BillScope reviews billing, interval usage, solar production, demand behavior, rate impacts and system-performance indicators.
3. See What Matters
View what changed, what is affecting cost and performance, and which actions deserve attention.
4. Track the Results
Address performance issues, reduce unnecessary utility costs and verify ongoing savings.
Who Benefits
Property Owners
Understand what is driving utility costs and where opportunities may exist.
Businesses
Gain better visibility into energy usage, demand charges, rate impacts, and operating patterns.
Solar Customers
Review system performance, annual true-up behavior, and utility billing impacts after solar installation.
Energy Professionals
Support recommendations with deeper utility data and billing analysis.
Measured Results from Commercial Properties
Annual Energy Performance — Commercial Steel Facility
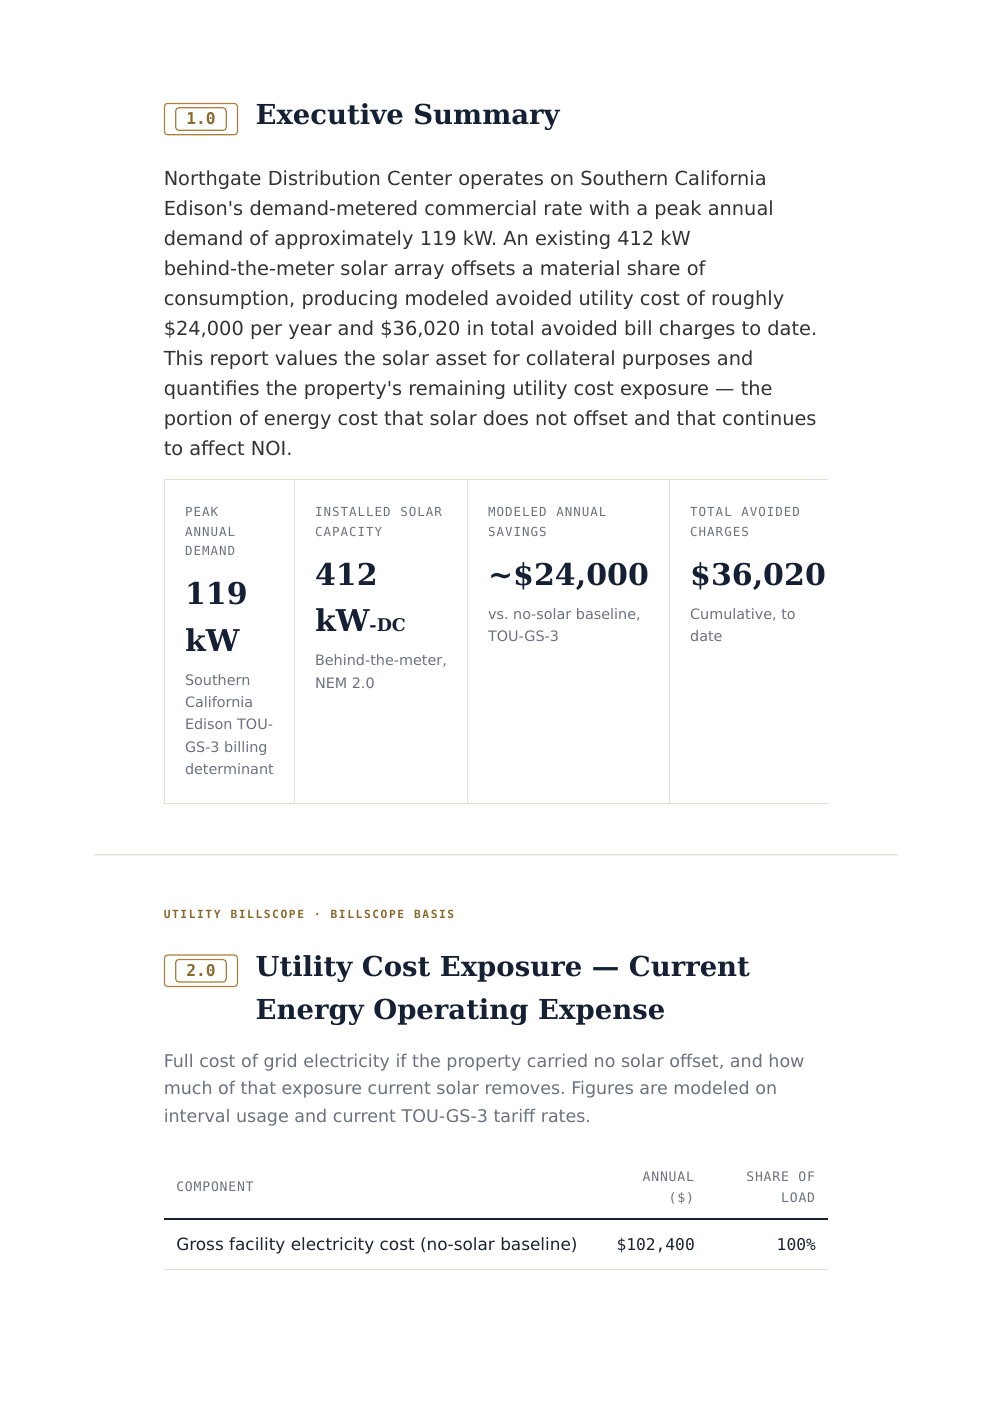
$24,233 in modeled annual savings identified. $36,020 in measured annual solar value documented.
Before & After Solar Cleaning — Commercial Wholesale Facility
A clear report showing the measured production change before and after cleaning.
Get Started with Utility BillScope
Connect your first commercial property and see what Utility BillScope can uncover. We’ll guide you through the utility-data, solar-data and authorization steps needed to activate your property.
Questions? Email reports@utilitybillscope.com