
One Platform.
Every Energy Dollar.
Utility BillScope connects utility bills, interval usage, solar production and financial performance in one clear picture. Verify ROI, uncover unnecessary costs and track whether improvements keep delivering results.
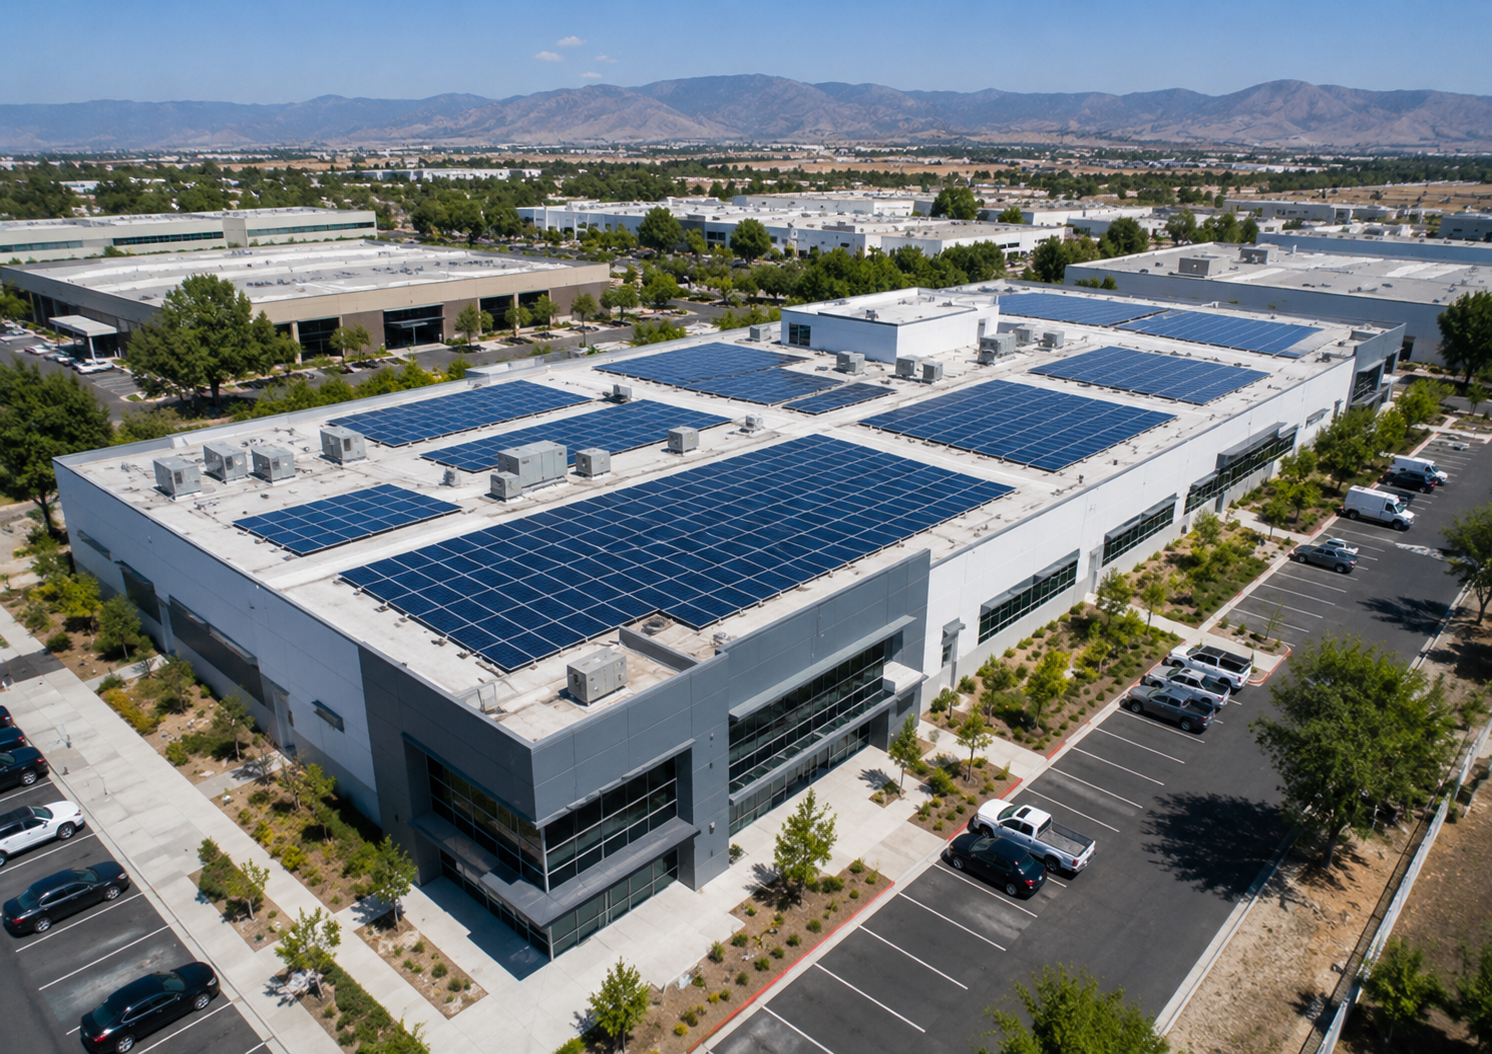
Platform overview
Complex energy data becomes a financial answer.
Executives see the return, the losses and the next action. Facilities teams still receive the evidence needed to understand what changed and why.
How it works
From connected data to a clear financial decision.
Utility BillScope does the analytical work behind the scenes and delivers concise reports built around business decisions—not a complicated dashboard your team has to decipher.
Connect the Data
Bring utility bills, interval usage and solar production together in one reliable record.
Verify Financial Performance
Measure annual value, actual ROI, payback and expected versus actual performance.
Identify Recoverable Value
Find rate exposure, demand costs and equipment underperformance that may be reducing return.
Monitor the Result
Track improvements, detect new losses and confirm that savings continue after action is taken.
Financial Performance
Clear results for executives. Supporting evidence for facilities teams.
Executive outputs
Financial answers your team can act on.
The headline is always the business result. Technical evidence remains available without taking over the story.
Financial Results
- Annual solar value
- ROI and payback
- Savings since installation
- Expected vs. actual results
Savings Opportunities
- Rate-plan savings
- Demand costs
- Steps to recover ROI
Before + After
- Before-and-after results
- Measured improvement
- Verified financial result
Supporting Evidence
- Utility bills and demand
- Interval usage
- Solar production
- Rate comparisons
Analysis + monitoring
A complete financial picture without the dashboard burden.
Utility BillScope separates what the platform analyzes from what it monitors, keeping the explanation clear and the lists easy to scan.
What We Analyze
Find the issues affecting financial performance.
- Utility billing and cost trends
- Time-of-use and rate-plan exposure
- Demand charges and peak-demand drivers
- Interval consumption patterns
- Solar production versus utility purchases
- Actual ROI, payback and delivered value
What We Monitor
Protect the result after improvements are made.
- Demand and energy-use patterns
- Solar production data
- Grid purchases and exports
- New peak-demand events
- Changes in utility-cost drivers
- Savings and performance

Reports built around decisions
Clear reporting—not another system your team has to manage.
Each report answers a specific business question and gives the reader a direct path from the result to the next action.
Annual performance report
Solar value, actual ROI, payback and savings since installation.
Before-and-after cleaning report
Measured improvement and the financial value of the intervention.
Ongoing monitoring report
New losses, sustained savings and changes requiring attention.
Start with the financial result
See the return. Find the losses. Protect the savings.
Connect your utility and solar data to receive a clear, human-reviewed view of financial performance.